As people and technology have evolved, so has our means of communication, both verbally and visually. The average person is exposed to the equivalent of 174 newspapers full of text each day, but with more than half the population (65% to be exact) being visual learners, obviously this leaves something wanting. Enter infographics! From the first cave paintings to the first use of bar graphs and pie charts in the 1800’s to our the modern day hybrid of graphic art and data; for centuries infographics have been used as a means to educate, persuade and inspire curiosity.
In terms of using an infographic as a marketing tool, studies show that visuals are processed 60,000 times faster in the brain than text and that most people only remember 20% of what they read. Not only that, publishers who use infographics found a 12% increase in traffic as compared to those who don’t. So if displaying data in the form of an infographic is the way to go, how can you make sure it’s novel enough to be noticed?
The Nitty Gritty
Like in any project undertaking, first thing to do is educate yourself thoroughly to ensure the success of your infographic, as well as to avoid any embarrassing mistakes before it takes off. This is obviously the less exciting and most time consuming part since most of the data you’ll need won’t come ready and waiting in a nice little package. Invest the time and don’t cut corners, we cannot stress the importance of becoming a pseudo expert in the field. Nothing is worse than pouring your heart into a project only to have it ripped apart because you didn’t do your research properly. Make sure you do your homework and read EVERYTHING; not only will it contribute to your knowledge base it’ll also help you to understand the underlying narrative. Boring data equals a boring infographic, but once you familiarize yourself, it’ll be easier to discover and create something compelling.
Find Your Inner Dr. Frankenstein
Once your data is good to go, it’s time to stitch it together. Like many good stories, there’s often a hero involved, the one piece of data that leads the rest or will surely make your jaw drop. Once you’ve determined your hero (not just the graphic designer putting it all together), it’ll be easier to place the supporting characters; think of it as a mood board. Developing this hierarchy will help to tell the rest of the story.
Then consider how you can translate your data into something visually understandable. There are many routes to take on this front, whether that’s keeping it traditional with beautifully executed charts, colors and typography or choosing to take a more creative, metaphorical approach that is visually narrative but might not necessarily come in the form of a chart. Ultimately, your data will help you decide on the best way to display it.
As important as it is to do your research, it’s also important to limit your scope to only the necessary elements so as not to overwhelm or over complicate. Focus on the main point instead of hindering it and remember: at the end of the day, infographics are meant for easy digestion.
It’s ALIVE!
Before you do anything else, give it a test drive. Send it around for your friend circle to try their eyes at to make sure that it’s understandable, appealing and most of all that there are no holes in the data before it goes out in the real world. After you get the go ahead, you’re golden! Infographics were meant for the internet, web and social media so share share share and open the floodgates for discussion.
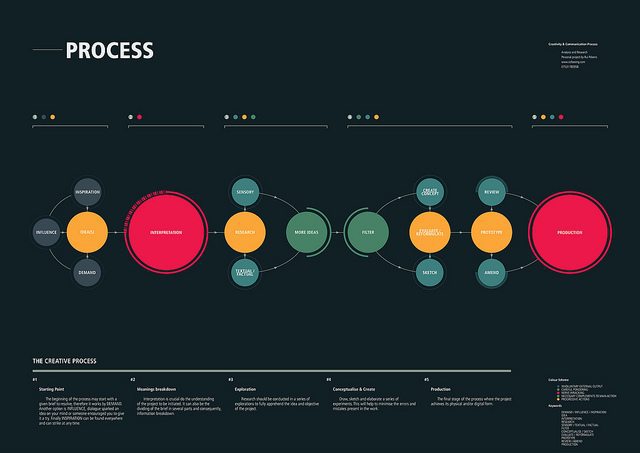
Image source via Stefan Leijon (Flickr)